An Overview of Distributed Tracing with OpenTelemetry in .NET 6
Introduction to OTel tracing; comparisons to OpenTracing; and non-obvious things you need to know.
- OpenTelemetry Tracing: Key Concepts
- OpenTelemetry Configuration + Architecture
- Next Steps with OpenTelemetry
I’ve given multiple talks and written posts about distributed tracing, a still relatively novel concept in the field of application performance monitoring (APM,) and how distributed tracing gives us observability into the dynamic run-time behavior of networked applications. I’ve also previously written about OpenTelemetry, “OTel” for short, an emerging industry-wide standard that combines distributed tracing with traditional metrics-based application performance monitoring into a single consumable standard that all APM vendors will eventually support.
In this blog post we’ll explore OpenTelemetry tracing in .NET 6.

Last time I wrote about the state of OTel for .NET was June, 2020 - shortly after we had just scrapped an experimental version of our Phobos Akka.NET APM product built on top of it due to performance and maturity concerns.
I’m pleased to report that OTel tracing is essentially complete and more-or-less released concurrently with the launch of .NET 6; OTel metrics is not quite done yet, however, hence the core OTel packages still being release candidates at the moment.
Due to demand from users and customers, Petabridge has started developing a Phobos 2.0 product which will replace our current OpenTracing + App.Metrics with OpenTelemetry tracing and metrics. Given my own experience working with OTel so far I’m confident this will be a success.
NOTE: if you’re not familiar at all with distributed tracing, I strongly recommend you read my post “How Distributed Tracing Solves One of the Worst Microservices Problems” first - otherwise you won’t get as much value out of this post.
Code Sample: https://github.com/Aaronontheweb/OpenTelemetry.Demo.AspNet
Clone the sample and follow the instructions in the README.md to try this yourself.
OpenTelemetry Tracing: Key Concepts
OpenTelemetry is the successor standard, resulting from the merging of the popular OpenTracing standard and the OpenCensus standard by Google. As such OTel derives most of its tracing concepts from what was already incorporated into OpenTracing.
From my “Why You Should be Paying Attention to OpenTracing” blog post:
- Trace - an end-to-end trace of an end-user request inside a distributed application; this trace might include correlating data from multiple services and multiple processes. It’s the output of the distributed tracing system.
- Span - a single, atomic unit of work that occurs inside an application. This can be one HTTP request processing method on an MVC controller, an Akka.NET actor processing a message, a RabbitMQ client sending a single message over the network, and so forth. Spans contain contextual data such as the name of the operation, the server / application it was executed on, the start and stop times, log events, and key / value pairs of tags that can be used to make the span searchable. A trace is constructed from the sum of its spans.
- SpanContext - a descriptor that is included inside each span which describes this span’s relationship to its parent span (i.e. the previous operation that occurred in processing the request) and to the trace itself. The SpanContext can also include “baggage” - key/value pairs of data that are propagated from one operation to the next. How this gets implemented is specific to each tracing implementation.
- Propagation - propagation is the tool used to serialize and deserialize data across service boundaries. Having standardized ways of representing trace ID, span IDs, and possibly baggage across service boundaries is one of the key ingredients for correlating data across services. In fact, it’s become so important that the W3C is actively working on implementing standardized distributed tracing header formats that will eventually make their way into HTTP itself. OpenTracing exposes some standard tools and formats for injecting / extracting trace information from requests, including non-HTTP vehicles such as Akka.NET actor messages, gRPC events, and so forth.
These concepts are what comprise the core ideas behind OpenTelemetry’s tracing specification as well - with some minor differences and updates:
- W3C has accepted the trace context recommendation as of November 23, 2021;
Baggage, the ability to propagate name/value pairs between the flow of asynchronous operations within a trace, is now its own separate API in OTel - although the “resolution” of the current baggage is still performed using the same scope resolution as the trace itself.SpanContextnow includes the concept of explicitly definedLinks between spans, which allows more complex relationships between operations to be described.
OpenTelemetry .NET APIs
One quirk unique to .NET’s implementation of OpenTelemetry is that it exists as two separate sets of APIs:
System.Diagnostics.Activity- beginning with the 5.0 version of theSystem.Diagnostics.DiagnosticSourceNuGet package released with .NET 5, all of the OTel-compliant tracing specification members were added to theSystem.Diagnostics.Activitytype. This is the basis for all distributed tracing at the level of the base class library in .NET.OpenTelemetry.Api- the actual OTel-named specifications, implemented as a wrapper shim around theSystem.Diagnostic.Activitytypes.
Generally it’s recommended to use the Activity and ActivitySource types from System.Diagnostics directly, unless you need access to the propagation or baggage APIs.
As a .NET application developer you don’t really need to use the OpenTelemetry.Api at all unless you need to manually propagate span context between services (i.e. when using Kafka, RabbitMQ, and so on) so you’re probably fine just using the ActivitySource and Activity APIs directly 99% of the time. If you have to write a custom OTel trace Processor / Exporter / Sampler all of those traces will be presented in their Activity form even if you recorded them using the OpenTelemetry.Api.Tracer SDK in the first place.
In our code sample we’re using the OpenTracing.Api package in one location, but otherwise most of the OTel implementation is transparent to us and done entirely through built-in middleware.
How is Trace Scope Resolved in .NET?
An important concept - imagine the following block of code in an ASP.NET MVC Controller that talks to an Akka.NET actor that uses Entity Framework to create a record:
public class IndexModel : PageModel
{
    private readonly ILogger<IndexModel> _logger;
    private readonly Tracer _tracer;

    public IndexModel(ILogger<IndexModel> logger, TracerProvider provider)
    {
        _logger = logger;
        _tracer = provider.GetTracer(TelemetryConstants.MyAppTraceSource);
    }

    public void OnGet()
    {
        using var mySpan = _tracer.StartActiveSpan("MyOp")
        	.SetAttribute("httpTracer", HttpContext.TraceIdentifier);
        mySpan.AddEvent($"Received HTTP request from {Request.Headers.UserAgent}");
    }
}
How do all of these operations get correlated together? If I’m kicking off my EntityFrameworkActor.Ask<EntityFrameworkActor.UserAdded> operation, how do I know which was the preceding operation that came before?
The answer is AsyncLocal<T> - it’s used internally by OpenTelemetry to keep track of the previous Activity and correlate them together.
So whenever we fire up our OTel demo application and visit the homepage, we generate a trace that looks like this in Jaeger:
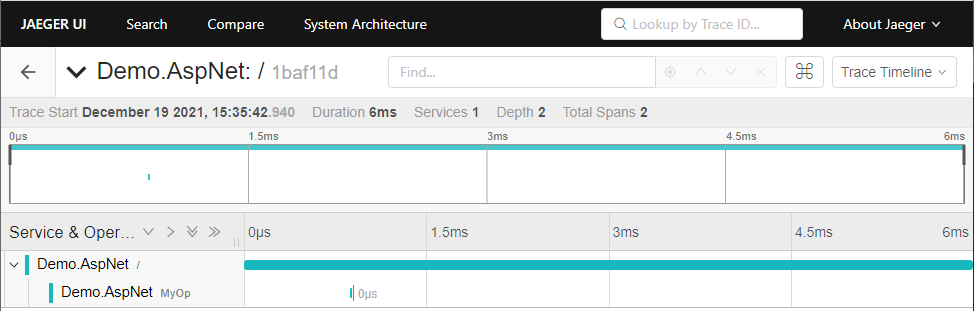
Each time a Tracer.StartActiveSpan or Activity.StartActivity call is made, the Activity.Current property is set to the new Activity. That Activity will flow down to each successive async call in the call chain until that Activity is marked as complete, which we almost always do via its IDipsosable that we can automatically terminate via a using statement or expression.
Most of this type of work will usually be done for you via an instrumentation package, but in the event that you need to manually trace activity or enrich system-generated traces inside your application it’s important that you know the details of how traces are correlated and how their APIs work.
OpenTelemetry Configuration + Architecture
One of the biggest changes between OpenTracing and OpenTelemetry is how telemetry is actually instrumented inside frameworks like ASP.NET and applications.
In OpenTracing APM providers simply had to implement the OpenTracing APIs inside their driver code, i.e. the ITracer, ISpan, IScope, and ISpanBuilder interfaces. This meant that it was up to each APM library to implement the specification and as a result performance + compliance could vary wildly.
In OpenTelemetry the componentry is much more decoupled and as a result, provides a significantly more predictable and reliable experience across APM vendors:
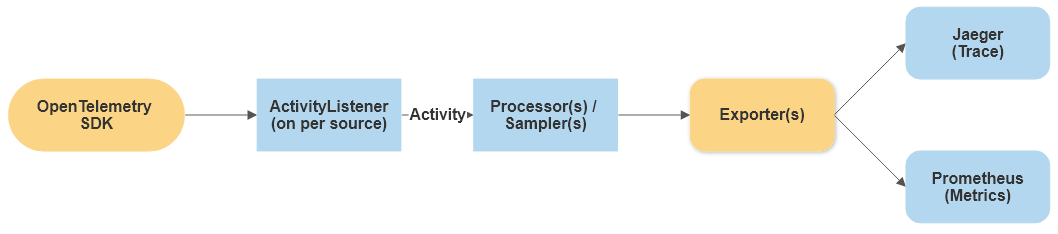
The OpenTelemetry SDK itself is what generates all of the traces and metrics produced by your application. Those traces are subscribed via the ActivityListener type, which passes any received traces through a pipeline of Processors which can perform important work such as trace filtering or sampling.
Any traces that pass through the Processor are sent to one or more Exporters, which are what actually write out your trace / metrics data into a format that can be consumed by an APM platform such as Jaeger tracing in our case. Typically exporters are maintained by the OSS project or commercial entity that maintains that particular APM platform.
So all traces and metrics are produced by the same underlying set of APIs and that data is asynchronously processed through a pipeline that allows traces and metrics to be uploaded out-of-band with your application.
Configuring OpenTelemetry Exporters, Instrumentation, and Service Metadata in .NET
In our demo application we’re using the new .NET 6 minimal APIs, but the approach I use there will also work without any issues using a traditional Startup.cs class found in earlier versions of .NET.
First, our .csproj file which contains our OpenTelemetry NuGet package dependencies:
<Project Sdk="Microsoft.NET.Sdk.Web">

  <PropertyGroup>
    <TargetFramework>net6.0</TargetFramework>
    <Nullable>enable</Nullable>
    <ImplicitUsings>enable</ImplicitUsings>
  </PropertyGroup>

  <ItemGroup>
    <PackageReference Include="OpenTelemetry.Api" Version="1.2.0-rc1" />
    <PackageReference Include="OpenTelemetry.Exporter.Jaeger" Version="1.2.0-rc1" />
    <PackageReference Include="OpenTelemetry.Extensions.Hosting" Version="1.0.0-rc8" />
    <PackageReference Include="OpenTelemetry.Instrumentation.AspNetCore" Version="1.0.0-rc8" />
    <PackageReference Include="OpenTelemetry.Instrumentation.Http" Version="1.0.0-rc8" />
    <PackageReference Include="OpenTelemetry.Instrumentation.SqlClient" Version="1.0.0-rc8" />
  </ItemGroup>
</Project>
So we’re using the OpenTelemetry.Api package only because that’s what I’ve been using over the past two weeks while working on Phobos 2.0 and it’s just muscle memory for me at this rate. You will probably not need to use this package in your own projects - the standalone OpenTelemetry base NuGet package, which is a dependency for all of the others, should be sufficient.
The OpenTelemetry.Instrumentation.* packages include the middleware that actively creates traces and in the future, metrics for all of the built-in Microsoft libraries that we’re using.
The OpenTelemetry.Exporter.* packages contain all of the APM-vendor-specific tooling needed to export OTel traces / metrics to that vendor’s implementation. It’s trivial to have multiple exporters for different services (i.e. Jaeger + System.Console logging) running concurrently.
Now to instrument our application, this is our entire Program.cs:
using OpenTelemetry.Demo.AspNet;
using OpenTelemetry.Resources;
using OpenTelemetry.Trace;

var builder = WebApplication.CreateBuilder(args);

// Add services to the container.
builder.Services.AddRazorPages();

builder.Services.AddOpenTelemetryTracing(b =>
{
    // uses the default Jaeger settings
    b.AddJaegerExporter();

    // receive traces from our own custom sources
    b.AddSource(TelemetryConstants.MyAppTraceSource);

    // decorate our service name so we can find it when we look inside Jaeger
    b.SetResourceBuilder(ResourceBuilder.CreateDefault()
    	.AddService("AspNet", "Demo"));

    // receive traces from built-in sources
    b.AddHttpClientInstrumentation();
    b.AddAspNetCoreInstrumentation();
    b.AddSqlClientInstrumentation();
});

var app = builder.Build();

// Configure the HTTP request pipeline.
if (!app.Environment.IsDevelopment())
{
    app.UseExceptionHandler("/Error");
    app.UseHsts();
}


app.UseHttpsRedirection();
app.UseStaticFiles();

app.UseRouting();

app.UseAuthorization();

app.MapRazorPages();

app.Run();
Inside our Index page we take a dependency on a TracerProvider in our constructor, which will become available to us as a result of the .AddOpenTelemetryTracing() extension method. Most of these lines are simple, but there are two in particular worth calling attention to.
Collecting Traces from Custom Sources
In order to collect trace data from a custom ActivitySource / Tracer, we need to make sure that our application subscribes to its output:
// TelemetryConstants.cs
public static class TelemetryConstants
{
    /// <summary>
    /// The name of the <see cref="ActivitySource"/> that is going to produce our traces.
    /// </summary>
    public const string MyAppTraceSource = "Demo.AspNet";
}
I use a const string to create a canonical name for the ActivitySource / Tracer specific to my application.
First, I ensure that I am subscribed to any traces produced by this source:
// Program.cs
// receive traces from our own custom sources
    b.AddSource(TelemetryConstants.MyAppTraceSource);
Next, I ensure that any traces I produce in my application are produced using this name:
// Pages/Index.cshtml.cs
_tracer = provider.GetTracer(TelemetryConstants.MyAppTraceSource);
These steps ensure that I close the loop on trace production + consumption inside my OpenTelemetry-enabled .NET applications.
Adding Service Metadata
If I’m running a full-blown distributed application that contains multiple services, different communication mediums, and so forth - I need to make sure that I can tell which spans were produced by which service.
Thus, I’m going to need to use the OpenTelemetry ResourceBuilder to help specify this metadata inside my application:
// Program.cs
// decorate our service name so we can find it when we look inside Jaeger
    b.SetResourceBuilder(ResourceBuilder.CreateDefault()
    	.AddService("AspNet", "Demo"));
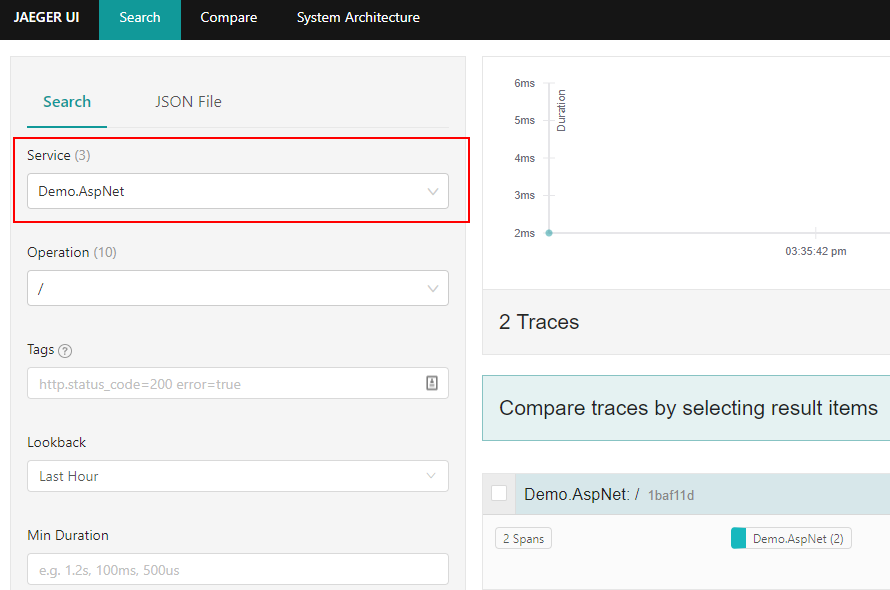
This line tells OTel that the traces exported by listeners in this application all belong to an app called “AspNet” in a namespace called “Demo” - thus when I look at Jaeger it will look like this:
In addition to specifying the service name and namespace, I can also use the ResourceBuilder to specify:
- The version of the service and
- The instance ID of the service (i.e. the hostname of each instance.)
OpenTelemetry has some reasonably good defaults for this, but you should probably override these values with something sensible just in case. For example: I almost always use Dns.GetHostName to name my instance IDs as I can trace that data back to the specific Kubernetes pod or Azure VM that generated a trace in my environments.
Next Steps with OpenTelemetry
So I’ve not even touched the OpenTelemetry Metrics APIs yet, which are still in beta as of writing this; there’s a lot more you can do using custom processors, using the Activity metadata itself (Attributes and Events); and I haven’t had a chance to benchmark the performance of OpenTelemetry vs. some of our OpenTracing libraries we’ve used in the past.
I’m looking forward to giving all of those a try in the future and would love to hear about your experiences in the comments!
Discussion, links, and tweets
I'm the CTO and founder of Petabridge, where I'm making distributed programming for .NET developers easy by working on Akka.NET, Phobos, and more..
Tweet Follow @Aaronontheweb